Representative pictogram | Method A | Method B |
|---|
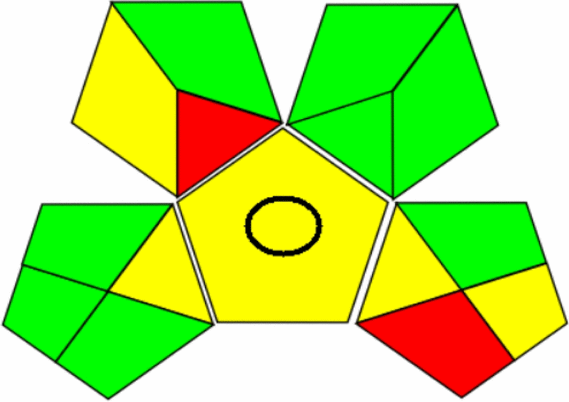
GAPIa | 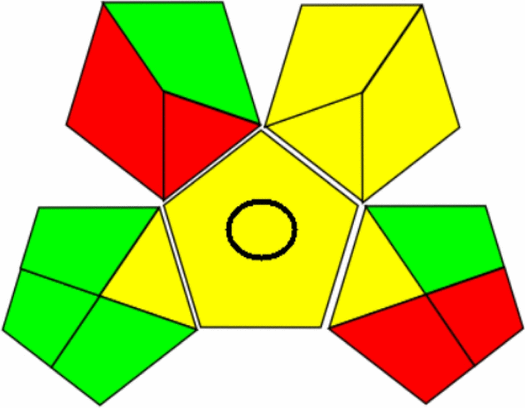
| 
|
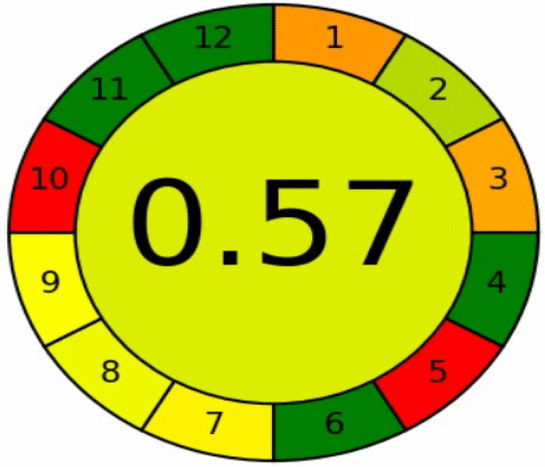
AGREEb | 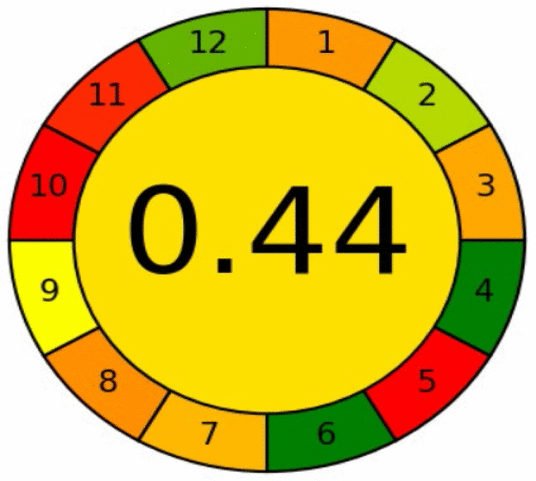
| 
|
- aThe color of the pictogram parts are green, yellow, and red indicating the low, medium and high environmental impact involved for each step of the procedures
- bThe resultant pictogram has overall score of fraction of unity in the middle of the pictogram with values close to 1 indicating greener procedures and divided into twelve sections with a number in each section corresponding to the criterion under evaluation, the width of each section indicates their importance and the color range from deep green to deep red reflecting the performance of the each criterion


